01 Sep

Better Tag Cloud for WordPress

The original way how WordPress sizes the tags in the tag cloud is a bit bad: if you have one tag that is used a lot, e.g. for every post, it makes all other tags too small to have any variance when compared to other less popular tags. I changed the way WordPress determines the size, get the patch here. It is also possible to define your own scaling algorithm, see the patch for more information.

This is how WordPress shows the cloud as of version 2.8.4

This is how WordPress shows the cloud as of version 2.8.4

This is how the cloud is changed by my patch

This is how the cloud is changed by my patch

21 May

Seen – Monitor bot activity on your WordPress blog

watchlist Seen is a WordPress plugin that shows when and which bots visit your blog. This can be useful to see if a page ever gets visited by bots (so you can adjust robots.txt or so) or simply to amuse yourself if you are obsessed with what is happening with your blog (everyone knows you are).

Additionally, you can get a better understanding of how fast a page gets indexed by search engines and how fast it gets reindexed after you have modified the page. I found it interesting to note what’s the general strategy of different bots, now I know Yahoo really keeps visiting the pages and GoogleBot just very rarely visits older pages (but indexes new pages really quickly).

The plugin uses some simple heuristics to decide if a visiting user agent is a bot and puts it in a list of suspected bots (along with data of which pages it visited and when). You can then remove all the user agents that are not bots. Basically, This means you don’t need to manually add any bots at all, you simply weed out the false alerts. Of course, you can explicitly specify bots by their user agent string or host address.

Installing and using Seen

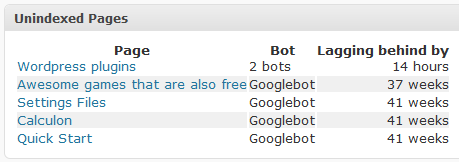
unindexedAfter installing the plugin (extract the zip file in wp-content/plugins/ and activate the plugin) data will be automatically recorded. You can monitor what is happening directly from on the Dashboard (there will be two new widgets, a list of bots on the watchlist and a list of unindexed pages). Also, if you go to Dashboard > Seen you can see more detailed lists and also the suspected bots list. I think it’s all quite self-explaining. Hint: you can click the star to add bots to the watchlist — clicking the yellow star will remove them.

In the options you can combine bots (i.e. when two or more entries have a differing user agent string but really are the same bot), delete them and edit them. The different categories are there so you can e.g. put Technorati bot in “Search engine (blogs)” which makes Seen not care if the bot has seen the latest comments. You can also categorize bots as “Browser” which means their data will be hidden as it probably won’t interest you.

Seen 0.5.1 (Supports WP 2.7 thru 2.8)

What’s new in 0.5.1

See comment #2 below.

Note: This is not yet 1.0 quality but it should work OK. By downloading and installing the plugin, you acknowledge no responsibility lays on the plugin author.

01 Mar

Use Macross to automate common WordPress post content

Here’s a macro plugin for WordPress I made. It features useful features for advertising, e.g. limiting the maximum amount of displayed ads.

macro view

What are macros?

A macro is a bit of text inside a post that, when displayed, will be substituted with other text. It simplifies editing of post and also provides a convenient way to insert repeating content.

Macros are useful for various uses:

  • Adding common content shared by multiple posts/pages
    • Post headers, footers and navigation between a series of posts
    • License disclaimers
    • Advertising inside post content (much more effective than leaving the ads outside the content)
  • Simplifying complex layout by hiding unnecessary formatting, e.g. adding an image with a caption using only a short macro
  • Quickly changing information on multiple pages, e.g. disclaimers, important notifications

Features

  • Configurable via the WordPress control panel system
  • Automatically limits the number of injected macros (useful for e.g. Adsense whose TOS states you can only have three instances per page)
  • Can be extensively controlled depending of page type (archive page, home page, single post etc.)

How it works

The macros are used by inserting text inside HTML comments when writing the post. Below is an example of a macro:

<!--adsense_inside_post-->

The macro looks like the above code when editing the post but when viewing the post (or page) it will be substituted with a Google Adsense advert (given that you have defined the macro).

Parameters can be used inside macros as follows. The first example is the text inside a post and the second is the macro defined on the Macross options page (with the name “image_with_caption”).

<--image_with_caption "image.jpg" "A photo I took last summer"-->
<p><img src="$1" alt="$2" /><br/>$2</p>

This macro will insert the text “A photo I took last summer” as the alt attribute for the tag and add it as a caption below the image.

You can use macros in a page template by using the expand_macro($name,$echo=true) function. This will also increment the counters. Here is the above example reinterpreted using expand_macro:

<?php expand_macro('image "image.jpg" "A photo I took last summer"'); ?>

By cleverly using macro priority (a lower priority macro gets injected first) you can use macros inside other macros. In combination with macro display options (i.e. if the macro is enabled for content, excerpts or feeds) you can use the same macro to expand into different text depending on where it is used.

Installation and configuration

Unzip the contents of macross.zip in your WordPress plugin directory and activate the plugin from Options > Plugins. Go to Options > Macross to create a macros. Counters work so that each successive macro injection increments the counter. If any of the specified counters for a macro exceeds the maximum value, the macro simply will not epand (also, none of the counters will be incremented).

The checkboxes next to a macro specify on which pages the macro will work. The first colum (Hook) tells Macross whether to expand the macro when actions the_content() or the_excerpt() is called. The third option enables the macro for the expand_macro() function. The rest of the checkboxes specify a page type, as returned by is_page(), is_single() and other conditional WordPress tags.

Download

Yes, the following is done with a macro, too. ;)

Links

  • Another macro plugin Originally, I wanted to use this, but found it cumbersome to edit macros. Also, it doesn’t have a counter/limiter system
24 Feb

Google Chart API is pretty cool

I just stumbled upon the Google Chart API and I couldn’t resist playing with it (statistics being a fetish of mine). A few moments later, I came up with some PHP code that uses my stats plugin for WordPress to fetch page views and generates an URL for the Google API (see below for the attached source code).

The main idea behind Google Chart is that the chart is an image and all data for the chart is in the URL. That includes the chart title, size and the data sets. Personally, I think this is a brilliant idea. You can embed the charts anywhere you can use images and best of all, you don’t need to have data anywhere else but in the URL (you don’t even need to duplicate the generated image in your own webspace).
You can also pretty much generate charts by hand if needed.

On the other hand, when using dynamic data fetched from a database, it is a relatively small task to encode the data into the format Google Chart uses. They even provide a Javascript snippet for that (obviously, you might want to do that server-side – see below). Or, you can simply use floating point numbers if you don’t mind long URLs (and I’m not even sure you can always use very long URLs).

For example, below there’s a graph generated from daily visits to this site:

And here is the URL used to get that graph (lines split for convenience):

http://chart.apis.google.com/chart?
chs=400x150&chd=s:NQGHJ&cht=lc&chdl=Page+views
&chxt=x,y&chxl=0:|Mon|Tue|Wed|Thu|Fri|1:|200|500

The above URL has quite Google-like short parameter names but that’s obviously because of technical limitations. The chd parameter is where the data set for the graph is: s:NQGHJsimple encoding : encoded data.

One interesting aspect arises because of the encoding: you need to fit your data set to use the granularity the encoding has. E.g. when using simple encoding and encoding a data set of 0, 4.7 and 244, you have to normalize and remap the data so the data goes from 0 (character A) to 61 (character 9), not from 0 to 244. That may sound horribly inaccurate but remember, nobody measures the charts with a ruler – they look at the numbers for accurate data. And there are more accurate encodings.

I like how the charts look slick. A lot of existing libraries and APIs for similar stuff tend to have less aesthetic appeal. Anti-aliasing does not better stats make but it certainly looks more professional. The API also has nice features such as adding arrows and red X’es on a graph (think an arrow with the caption “stock market crash” – after which the graph plummets), the always useful Venn diagrams (see right) and other usual stuff you’d need.

Anyway, my original point was that Chart is a cool API, is probably easier to use and faster to install than gnuplot or other chart drawing software, is compatible with any browser able to display images and it’s free for everyone to use (the limit is something like 50 thousand views per user per day – and I guess their policy says nothing against caching the charts on your own site). Check it out.

P.S. This is quite obvious but… I predict that in the future, Google will use the accumulated charts for some kind of statistics search. The charts contain text (label, title) so a Google search result might include relevantly labeled graphs. Which is an interesting scenario, considering the Internet is full of lies, kooks and gullible users.

18 Feb

A simple statistics plugin for WordPress

Here’s a very simple plugin for WordPress that keeps track of view counts of individual pages. It is not intended to be a complete statistics solution. Rather, the main purpose is to provide something for those empty spots in your site layout.

Here is a sample graph (page views for this site):

For a better example, see the site stats page.

Features

  • Keeps day-by-day based page view stats using the database
  • Outputs a clean histogram
  • Includes easy functions for those who are better at blogging than programming

Installation

Copy viewcount.php in /wp-content/plugins and enable it in WordPress options. Enter the path of the directory you want to the graph cache to be located in the options page (Options > Viewcount). The plugin will then start counting page views.

Note: the plugin taps into the_content(). Pages that do not use it will not update the stats! See below for a workaround.

Usage

To display statistics, there are a few functions.

get_view_histogram($page=-1,
  $days=60,
  $barwidth=10,
  $barheight=16,
  $barspacing=1,
  $barcolor='#000000',
  $backgroundcolor='#ffffff',
  $web20=16)

get_view_histogram() returns a URL to a PNG image.

If $page is unset or is -1, the data will be the combined page views for all pages. $web20 specifies the height of a “Web 2.0” style reflection under the bars. The rest of the parameters should be easy enough to figure out.

You can use the function like this to display the statistics for the current post (or page):

<img src="<?php echo get_view_histogram($post->ID); ?>" />

You can also display a top list of page views with get_view_count_list().

get_view_count_list($limit=10,
  $days=30,
  $before='<li>',
  $after='</li>',
  $excludeid='',
  $type='')

$excludeid is a comma-separated list of post IDs (note:the list is not escaped so do not use any values in there that come straight off $_GET or so!). $type is either “post” or “page”, empty string returns both.

You can exclude the page that is currently viewed like this (shows the top five pages from the last 30 days excluding post ID $post->ID):

get_view_count_list(5,30,'<li>','</li>',$post->ID);

To display a Popularity Contest style percentage (the percentage of traffic a post has compared to other posts), use get_popularity($page=-1,$days=30,$format=’percent’). if $page equals to -1, the current page ID will be used automatically. $format can be either ‘percent‘ or ‘float‘ — ‘percent‘ returns a string with the percent sign, ‘float‘ returns a floating point number between 0.0 and 1.0. The following will display a percentage of page views for the current page during the last 30 days.

<?php echo get_popularity(); ?>

To display all time statistics, you can simply do this:

<?php echo get_popularity(-1,99999); ?>

This will display all time statistics, unless your blog has been online for more than 274 years.

To get the list of most viewed pages, use the function get_top_pages($days=30,$limit=10,$type=’views’). $type is either ‘views’ or ‘popularity’.

You can request more functions!

Download

viewcount.zip

Notes

You need the GD library installed for PHP.

I created the plugin to see how that is done. Therefore, crap code ensues (see the warning about excluding posts above).

The plugin will count views for pages and single posts only. Page views from users who are logged in (e.g. you) will not be logged.

The plugin taps into the_content() to count views. You can use vc_update_counter($id) to manually update the page views (or, you can be creative and count very different stuff with it – just make sure the ID is not in use by real pages).

In case you think the graph is wrong: the bar height is normalized. This is just so there is interesting variation in the height.